Deals & Opportunities
The Opportunities tab is a dual-mode forecast board: kanban for in-flight deal movement, table for dense multi-column analysis. Stages, WIP limits, probability bands, and close-date tags are stable across renders so your muscle memory builds up over time.
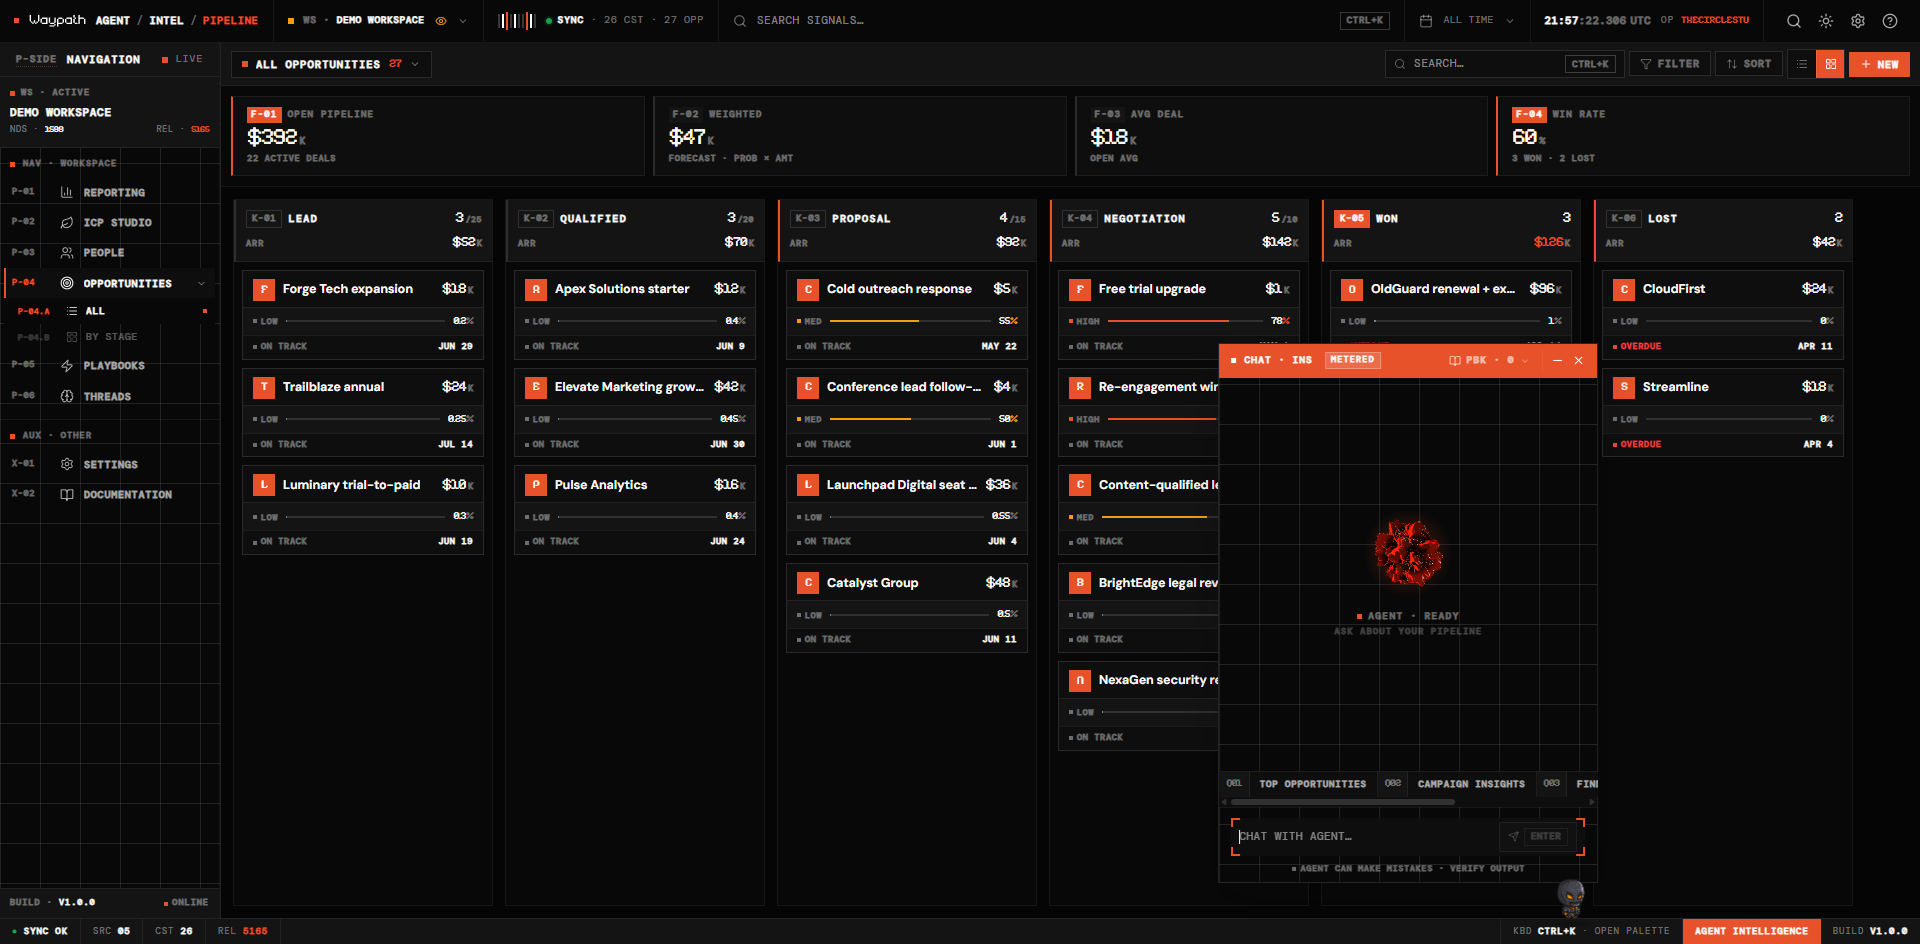
01Forecast KPI strip
A four-card KPI strip sits above the board. Every number reads from
stats.byType['Opportunity'] workspace-wide, never from the paginated
table page.
| Code | Metric | Notes |
|---|---|---|
| F-01 | Open Pipeline $ARR | Sum of amount on open deals. Vermillion rail. |
| F-02 | Weighted Forecast | Σ (amount × probability); the forecast number leadership actually uses. |
| F-03 | Avg Deal | Open-only; zero-filter for fairness vs historical averages. |
| F-04 | Win Rate | won / (won + lost). Turns vermillion at ≥50%. |
02Kanban board
Six stable stages render left-to-right, with a tone-mapped left rail that ramps cool → warm → vermillion on WON and red on LOST.
| Code | Stage | Tone |
|---|---|---|
| K-01 | LEAD | neutral |
| K-02 | QUAL | warm |
| K-03 | PROP | warm |
| K-04 | NEG | vermillion |
| K-05 | WON | vermillion |
| K-06 | LOST | red |
Each column shows:
- Column code + stage name (Sudo numerals on the code, mono uppercase label)
- Total ARR for the stage
count / wipLimit. Turns vermillion when over cap- Dashed drop-zone with vermillion tint on drag-over
03PipelineCard
Each deal card renders with:
- Header: company-initial sigil + deal name + Sudo amount
- Meta row: mono; includes a days-in-stage chip heat-colored by staleness:
> 21d→ vermillion> 14d→ amber- otherwise → muted
- Probability bar:
- HIGH (≥70%) → vermillion
- MED (≥40%) → amber
- LOW (<40%) → muted (no green. We don't reward uncertainty with a calm color)
- Close-date footer: proximity band:
ON TRACK·DUE SOON·OVERDUE - Card border ramps to vermillion on hover.
04Table view
Toggle via the view switcher in the toolbar. Provides sortable columns for deal name, stage, value, probability, company, owner, and close date.
05Creating deals
Click + NEW in the toolbar. Required:
- Deal name
- Stage
Optional: associated company, amount, probability, close date.
06Opportunities in Intelligence
Deals with strong engagement signals plus opportunities from Orange Slice hyper-signals appear as red Opportunity nodes in Intelligence, scored 0-100. See Find Leads for how hyper-signals surface as Opportunity nodes automatically.