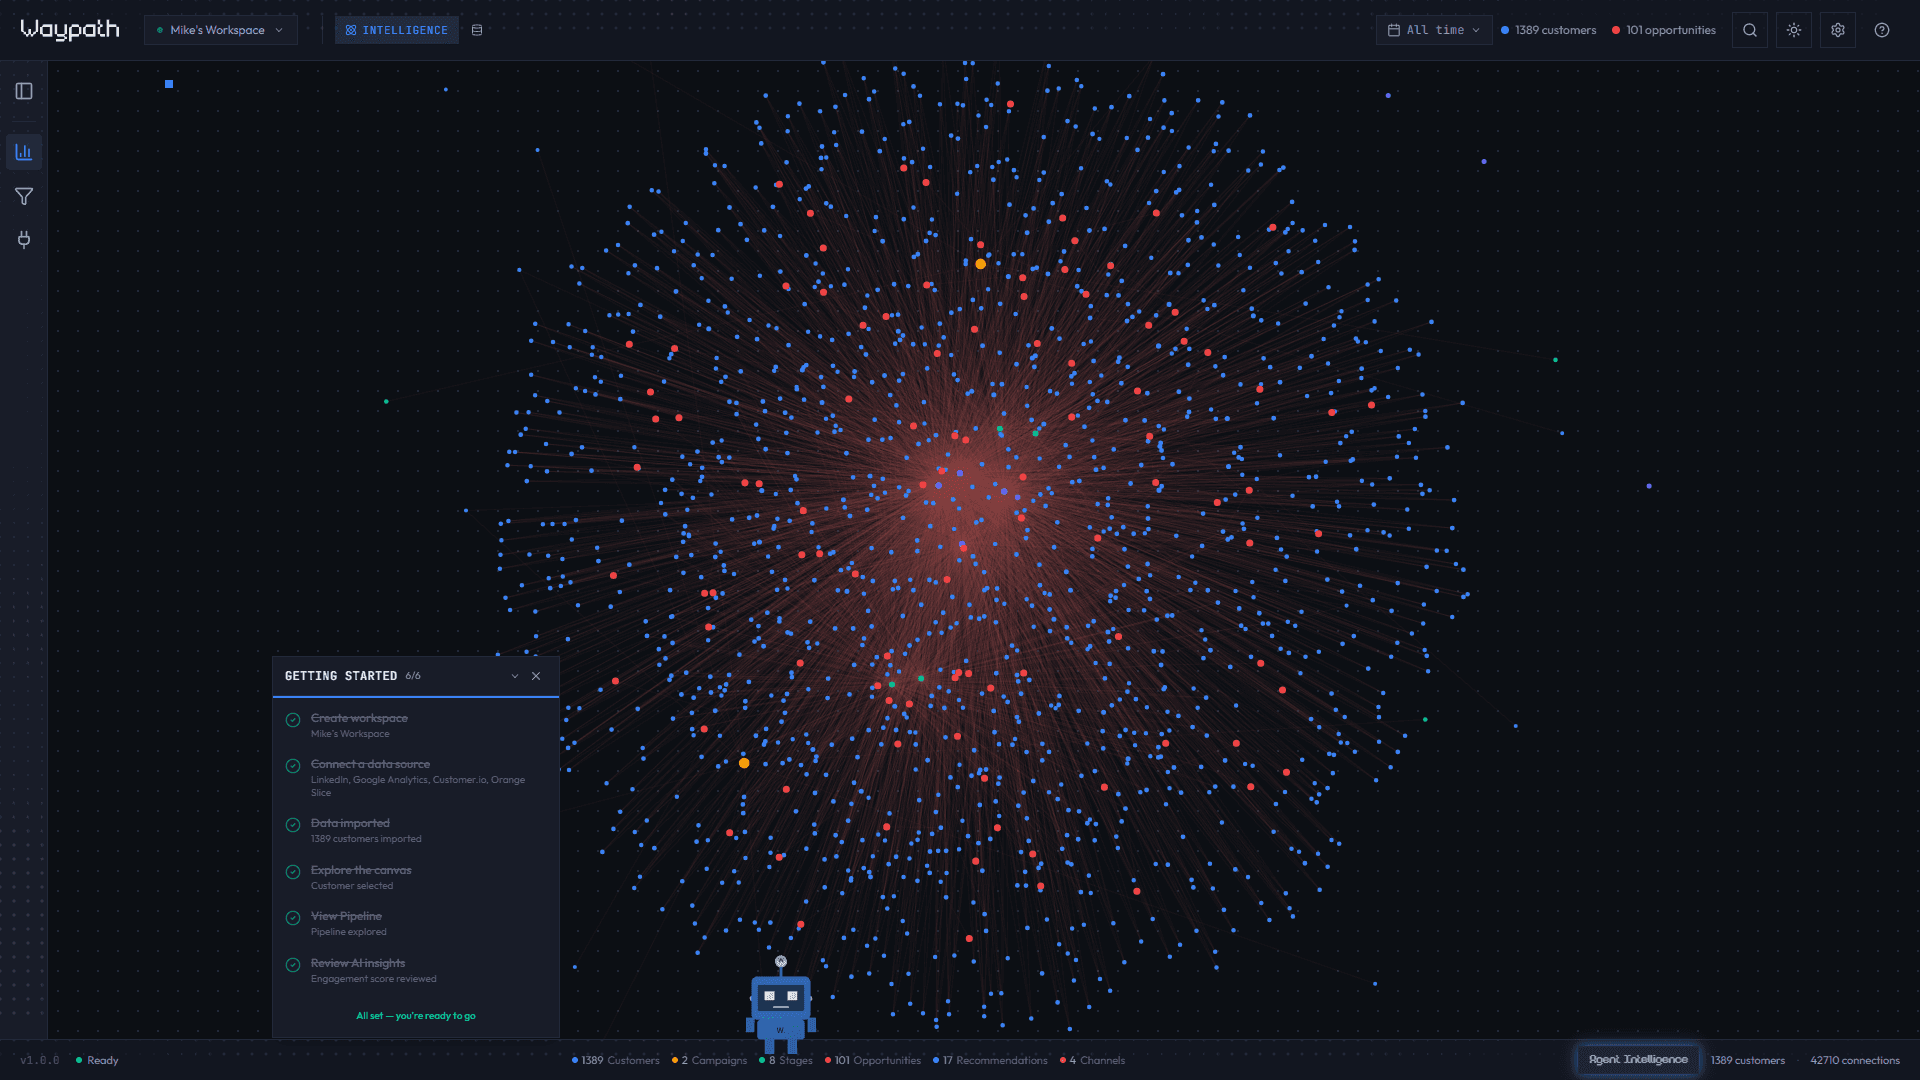
Explore Your First Graph
With data connected, the Intelligence view shows your engagement correlation graph.
Navigating the canvas
| Action | How |
|---|---|
| Pan | Click and drag the background |
| Zoom | Scroll wheel or pinch |
| Select a node | Click any node |
| Search | Cmd+K (Mac) or Ctrl+K (Windows) |
| Reset view | Click the target icon in the graph controls |
Rendering
The graph uses Sigma.js with WebGL rendering. Nodes are positioned by the ForceAtlas2 algorithm, which runs in a web worker for smooth, force-directed layout even with thousands of nodes.
A 3D mode using Three.js is coming soon.
Reading the graph
Each node type has a distinct color:
| Node | Color | What it represents |
|---|---|---|
| Customer | Blue | A person or company across all platforms |
| Campaign | Amber | A marketing campaign (email blast, ad set) |
| Touchpoint | Emerald | A single interaction (email open, click, purchase) |
| Stage | Orange | A step in the campaign funnel |
| Opportunity | Red | An AI-detected buying signal |
| Channel | Pink | A communication channel (email, SMS, social, web) |
| Segment | Indigo | A manual customer grouping |
| Product | Violet | An item purchased or browsed |
| Recommendation | Sky | An AI-generated campaign insight |
Edges show relationships like HAS_TOUCHPOINT, INFLUENCED_BY, AT_STAGE, and more.
See the full Node Types and
Edge Types reference.
Filtering
Use the Filters tab in the left panel to show or hide specific node types and edge types. This helps you focus on the relationships that matter most.
Insights panel
When you select a node, the right panel shows:
- Node details: properties, timestamps, scores
- AI insights: for Customer nodes, AI-generated campaign recommendations
- View in Pipeline: jump directly to the corresponding CRM record
Switching to Pipeline
Click the Pipeline tab in the header to switch to the CRM table view. You can also click View in Pipeline on any Customer node to jump directly to that contact’s record.
See the Pipeline View guide for a full walkthrough.